

An Outlook on The Markets
QUARTERLY UPDATe
Need help understanding how the market affects your finances?
Each quarter we provide a comprehensive outlook on economic trends, market performance, and our investment strategies. Crafted for clarity and accessibility, these reports deliver valuable insights for clients.
July 2026 | Strength Behind The Headlines
The 2026 World Cup has offered a timely reminder that headlines rarely tell the whole story. At a time when much of the world seems consumed by geopolitical conflict and division, millions of people have gathered to celebrate sport, community, and shared experiences. Images from the tournament have shown strangers becoming friends, cultures coming together, and common ground emerging where many expected only differences. Although the United States exited the tournament earlier than we may have hoped, the event itself has been a celebration of connection that has defied expectations.

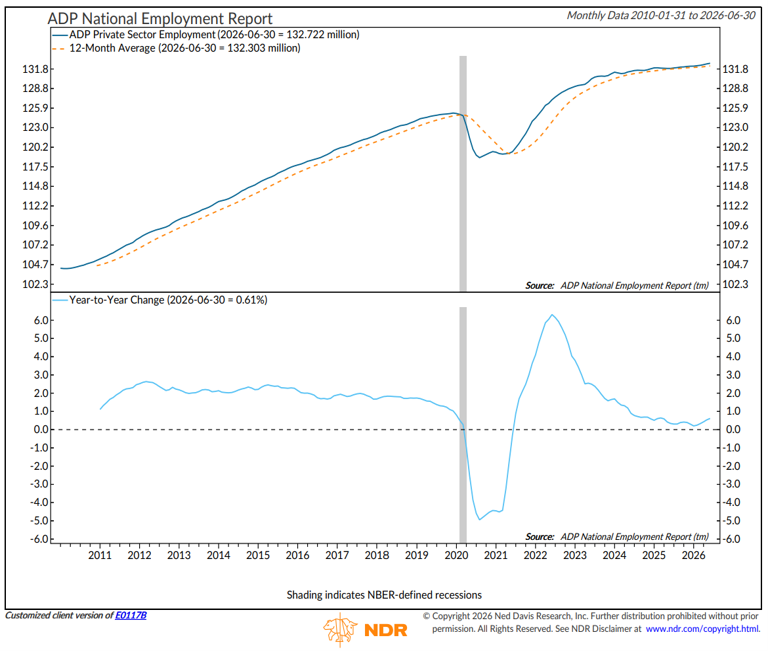
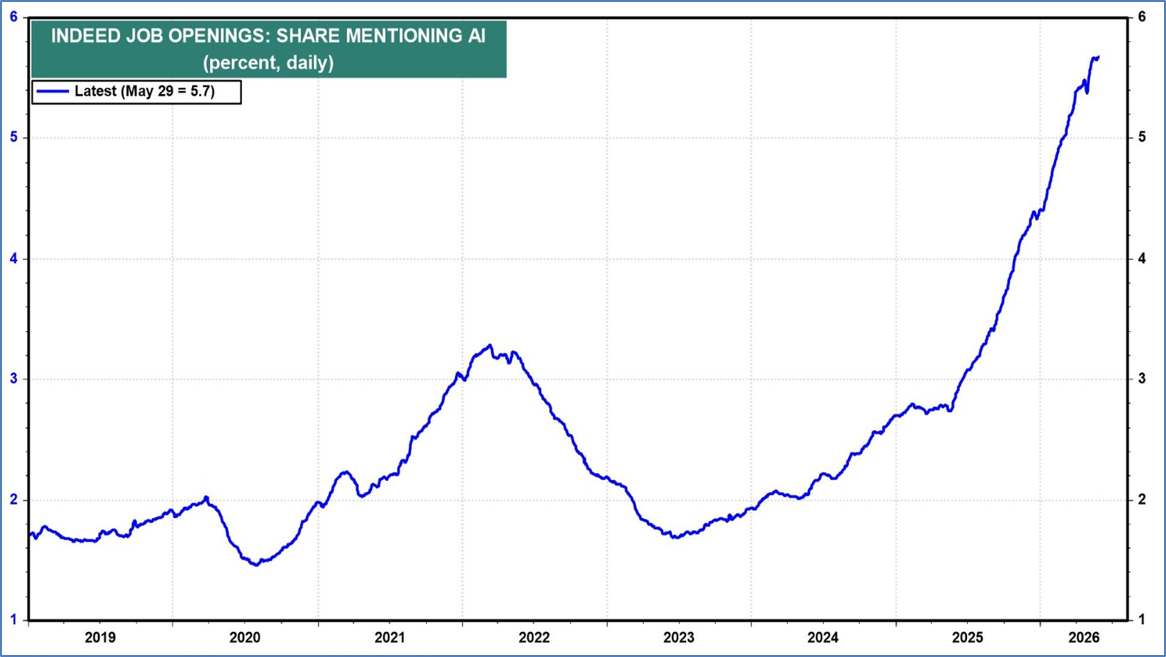
We see a similar disconnect between today’s economy and much of the financial discourse. Artificial intelligence continues to dominate the headlines, with many predicting widespread job displacement and economic disruption. Yet the data paints a more nuanced picture. In our view employment remains healthy, and demand for workers with AI-related skills continues to grow across industries. The accompanying charts highlight both the stability of the labor market and the rapid increase in job postings seeking AI proficiency.(1,2)
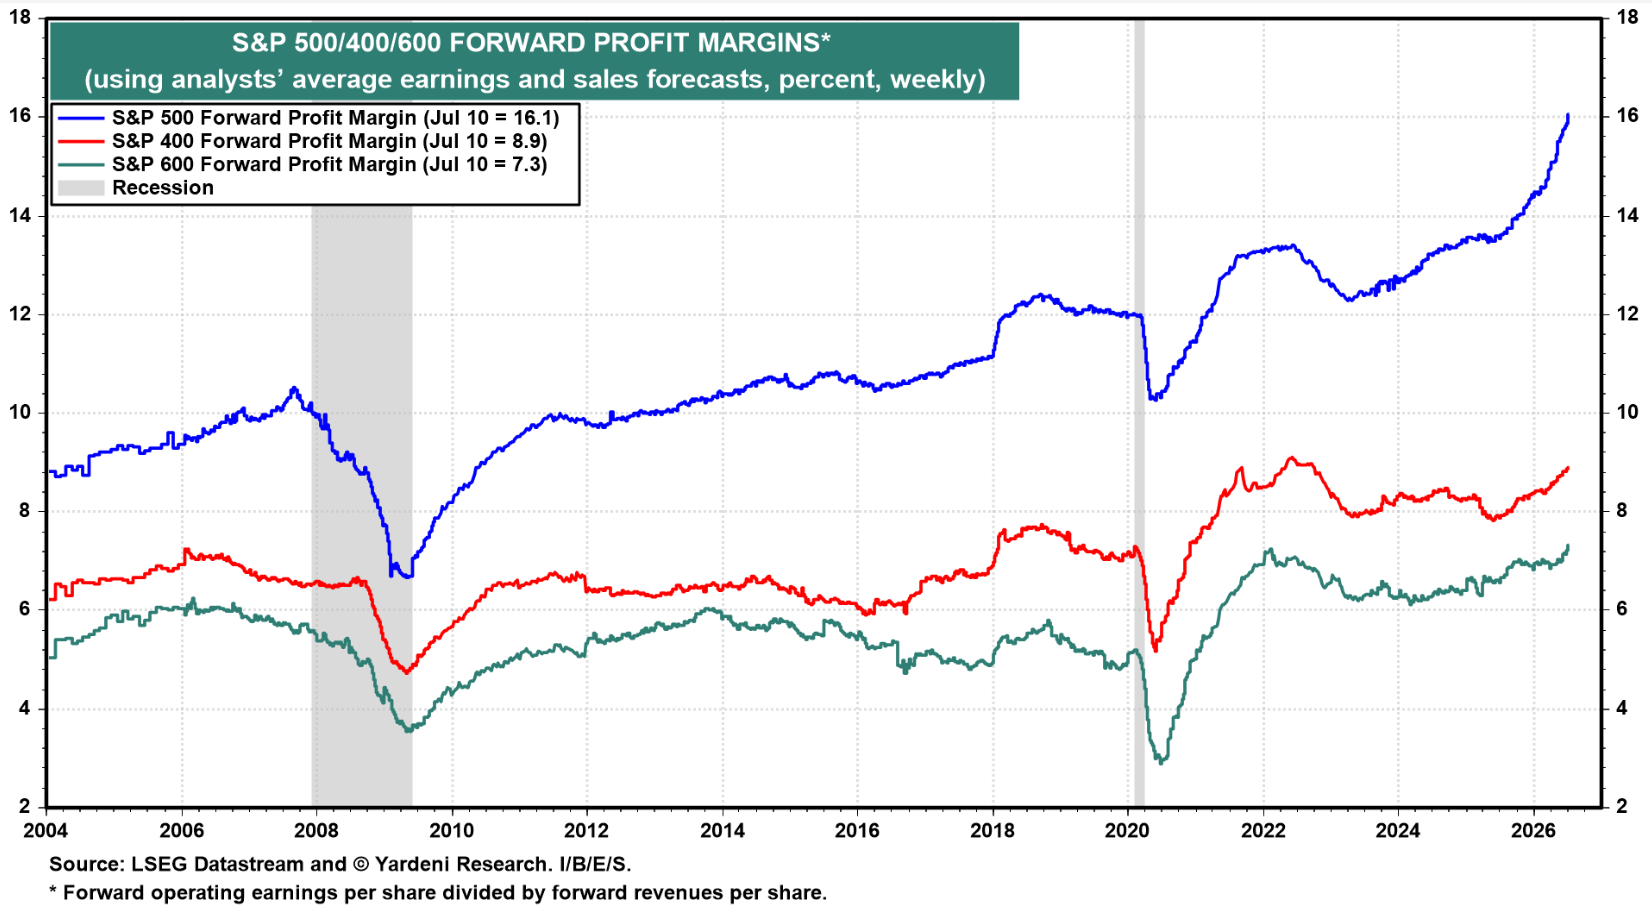
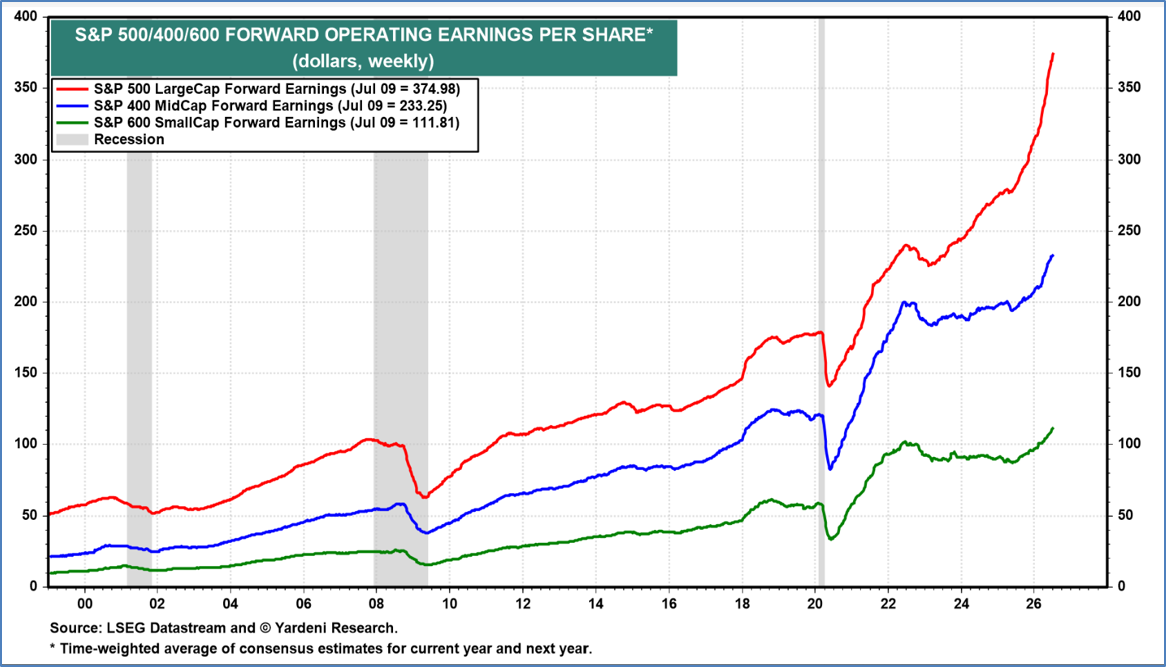
It is still too early to know how much AI will ultimately improve productivity, but several developments are encouraging. Corporate profit margins have continued to expand, and earnings growth has accelerated across large-, mid-, and small-cap companies. These developments suggest businesses are adapting effectively and beginning to realize some of the benefits of technological innovation.
That broader improvement is encouraging because healthy earnings growth ultimately benefits employees and investors alike. At the same time, we believe it is important to remain disciplined. Markets are forward-looking, and today's stock prices already reflect considerable optimism about future earnings.(3,4)
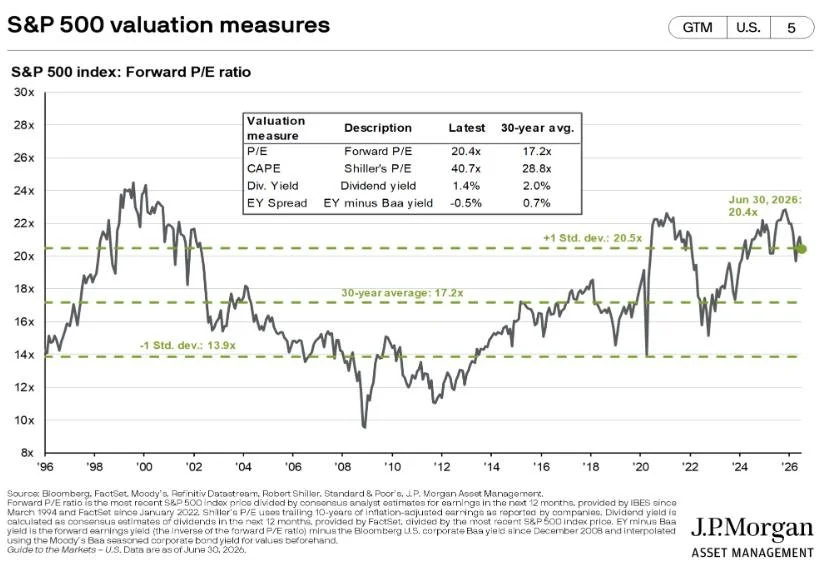
As our final chart shows, valuations remain above long-term averages across several measures.(5) That doesn't necessarily mean markets are due for a correction, but it does suggest that much of the recent good news may be reflected in current prices, and future returns are likely to depend more on continued earnings growth than on investors’ willingness to pay even higher prices for those earnings.
One of Wall Street's oldest axioms is that markets often 'climb a wall of worry', meaning that periods of persistent uncertainty often create the conditions for durable market advances when reality turns out to be less dire than predicted.
Before the World Cup began, many wondered whether global tensions would diminish attendance and enthusiasm. Instead, stadiums have been full, visitors have been enthusiastic, and the tournament has brought people together in ways few anticipated. Likewise, despite ongoing concerns surrounding artificial intelligence, the underlying fundamentals of the economy – including employment, corporate profitability, and earnings – remain stronger than many headlines would suggest.
Markets have spent the past two years wrestling with inflation, interest rates, tariffs, geopolitical conflict, and now artificial intelligence. Yet despite this shifting focus, the underlying economy has remained remarkably resilient. Headlines capture our attention, but fundamentals determine long-term outcomes. Today, we believe the strength behind the headlines tells the more important story.
— Brad Dinsmore
1. CHART SOURCE: Ned Davis Research, July 13, 2026
2. CHART SOURCE: Yardeni Research, June 30, 2026
3. CHART SOURCE: Yardeni Research, July 13, 2026
4. CHART SOURCE: Yardeni Research, July 13, 2026
5. CHART SOURCE: J.P.Morgan Asset Management, July 13, 2026
NOTE: The S&P 500 Index is a market-capitalization weighted index that includes the 500 most widely held companies chosen with respect to market size, liquidity, and industry. Investors cannot invest directly in an index.
April 2026 | Sage Advice from the Oracle
Developments in the Middle East are understandably top of mind, and the human consequences certainly far outweigh any economic considerations. While we all hope for a peaceful resolution, our role as wealth managers is to focus on the implications for the economy and financial markets, which are the subject of this letter.
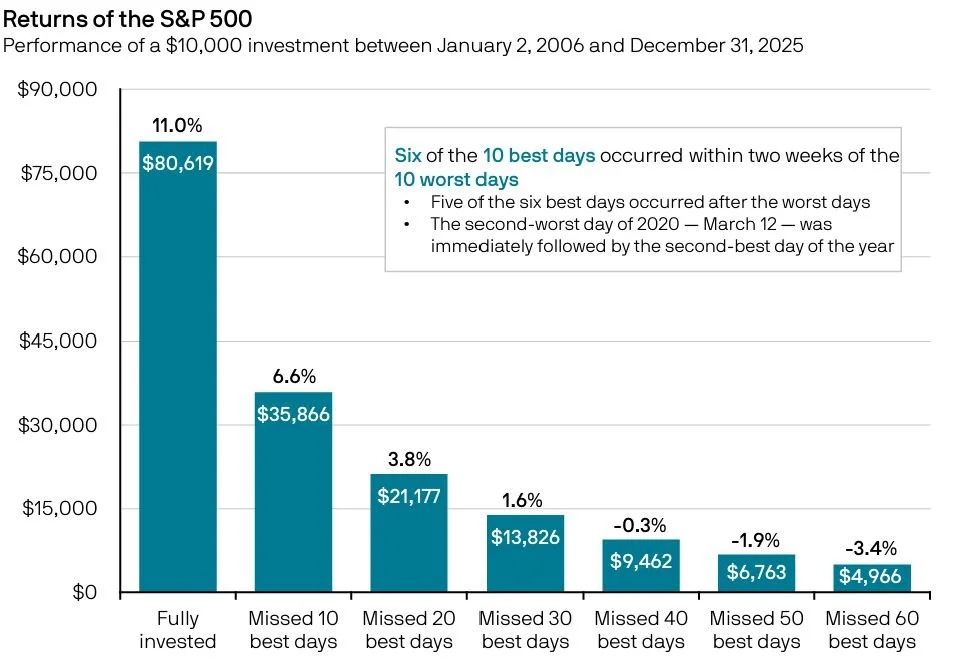
In times of crisis, it is a natural instinct to try to protect what matters most. However, history suggests that attempts to reposition portfolios based on near-term headlines have often proven to be counterproductive. Many of the market’s strongest days occur very close to its weakest, and missing those periods can have a meaningful impact on long- term results, as illustrated in the chart below.(1*) For example, missing just the 10 best days over the past 20 years would have reduced the annual return of the S&P 500 from 11% to 6.6%.(2*)
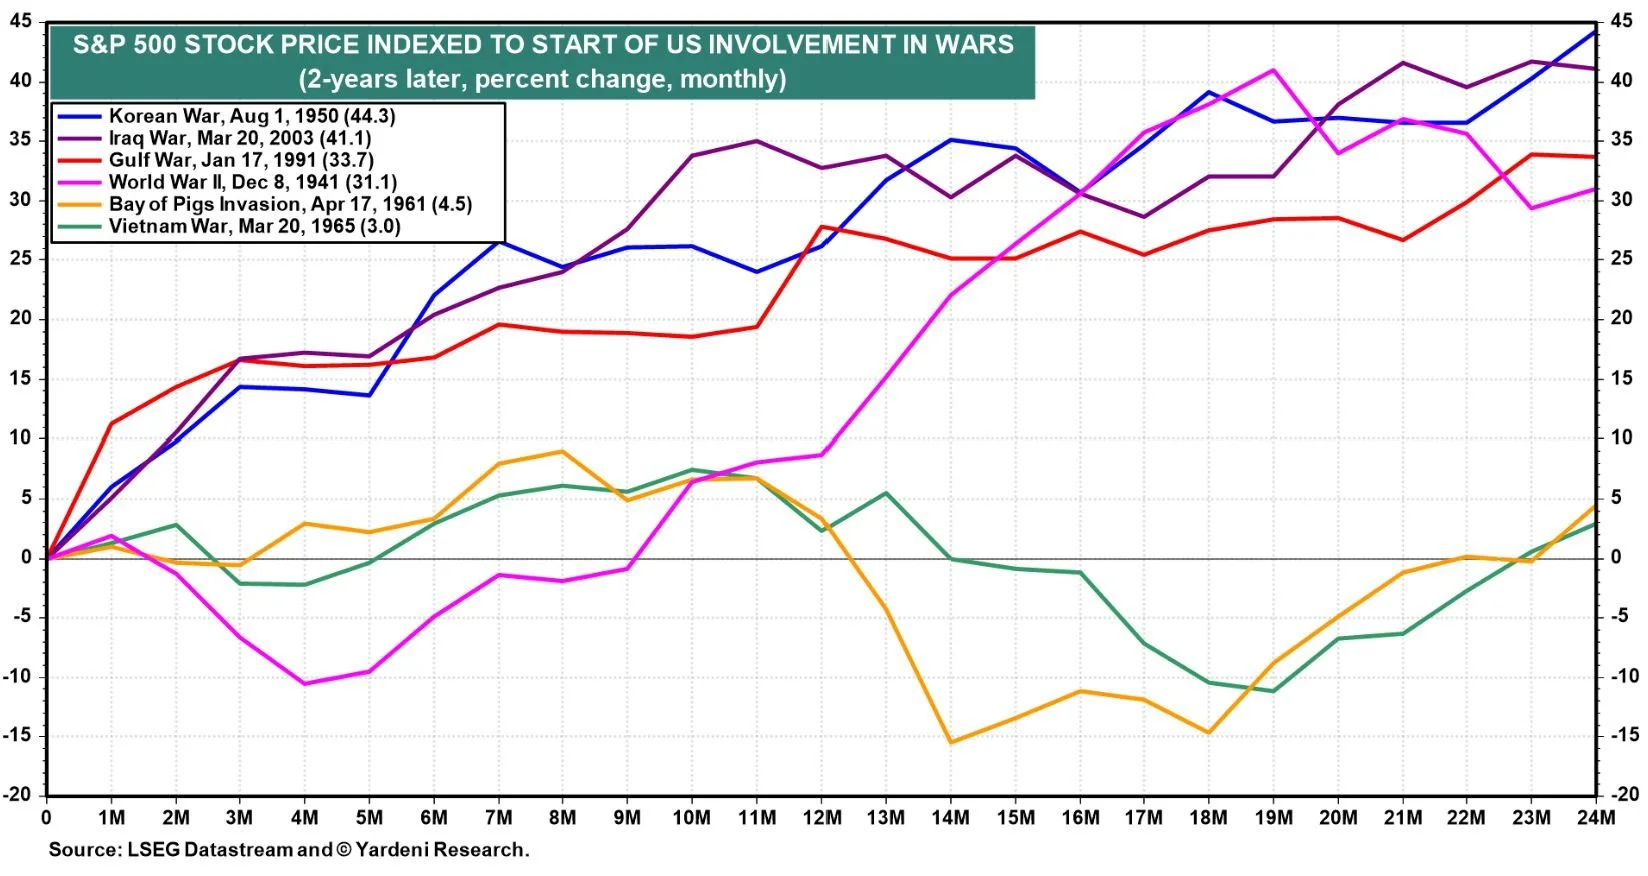
When looking specifically at periods of conflict, history offers a similar perspective. The chart below shows that the S&P 500 has been higher two years after the start of the past six major US military engagements.(1*)
Investment strategies should evolve as personal or financial circumstances change, but history suggests that making significant shifts in response to geopolitical events has often been a mistake. Over time, investment performance is driven primarily by business and economic fundamentals, and these will continue to guide our decisions.
We will close with some perspective from Warren Buffett, who retired last year but whose wisdom endures. Writing during the 2008–2009 financial crisis, The Oracle of Omaha offered the following reminder:
In the 20th century, the United States endured two world wars and other traumatic and expensive military conflicts; the Depression; a dozen or so recessions and financial panics; oil shocks; a flu epidemic; and the resignation of a disgraced president. Yet the Dow rose from 66 to 11,497.(3*)(4*)
— Brad Dinsmore
1. CHARTS: JP Morgan Asset Management 2026 Guide to Retirement, February 26, 2026 & Yardeni Research Quick Takes, April 5, 2026
2.The S&P 500 Index is a market-capitalization weighted index that includes the 500 most widely held companies chosen with respect to market size, liquidity, and industry. Investors cannot invest directly in an index.
3.The Dow Jones Industrial Average (DJIA or “the Dow”) is a price-weighted index tracking 30 prominent U.S. blue-chip companies. Investors cannot invest directly in an index.
4. Source: The New York Times, October 16, 2008
January 2026 | DATA DRIVEN
In last quarter’s letter, we discussed the importance of focusing on the underlying economic and financial data rather than the endlessly tumultuous headlines. This task is often far easier in theory than in practice. Whether global upheaval from Iran to Venezuela, or domestic politics from the White House to the Federal Reserve, the news has rarely been more captivating. Like many of you, we follow these developments with interest and concern. However, in our role as wealth managers, our responsibility is to remain focused on long-term business fundamentals and the careful stewardship of client assets. While politics can influence markets in the short run, history consistently shows that over time, stock prices are driven by earnings - and earnings are driven by consumer and business spending.
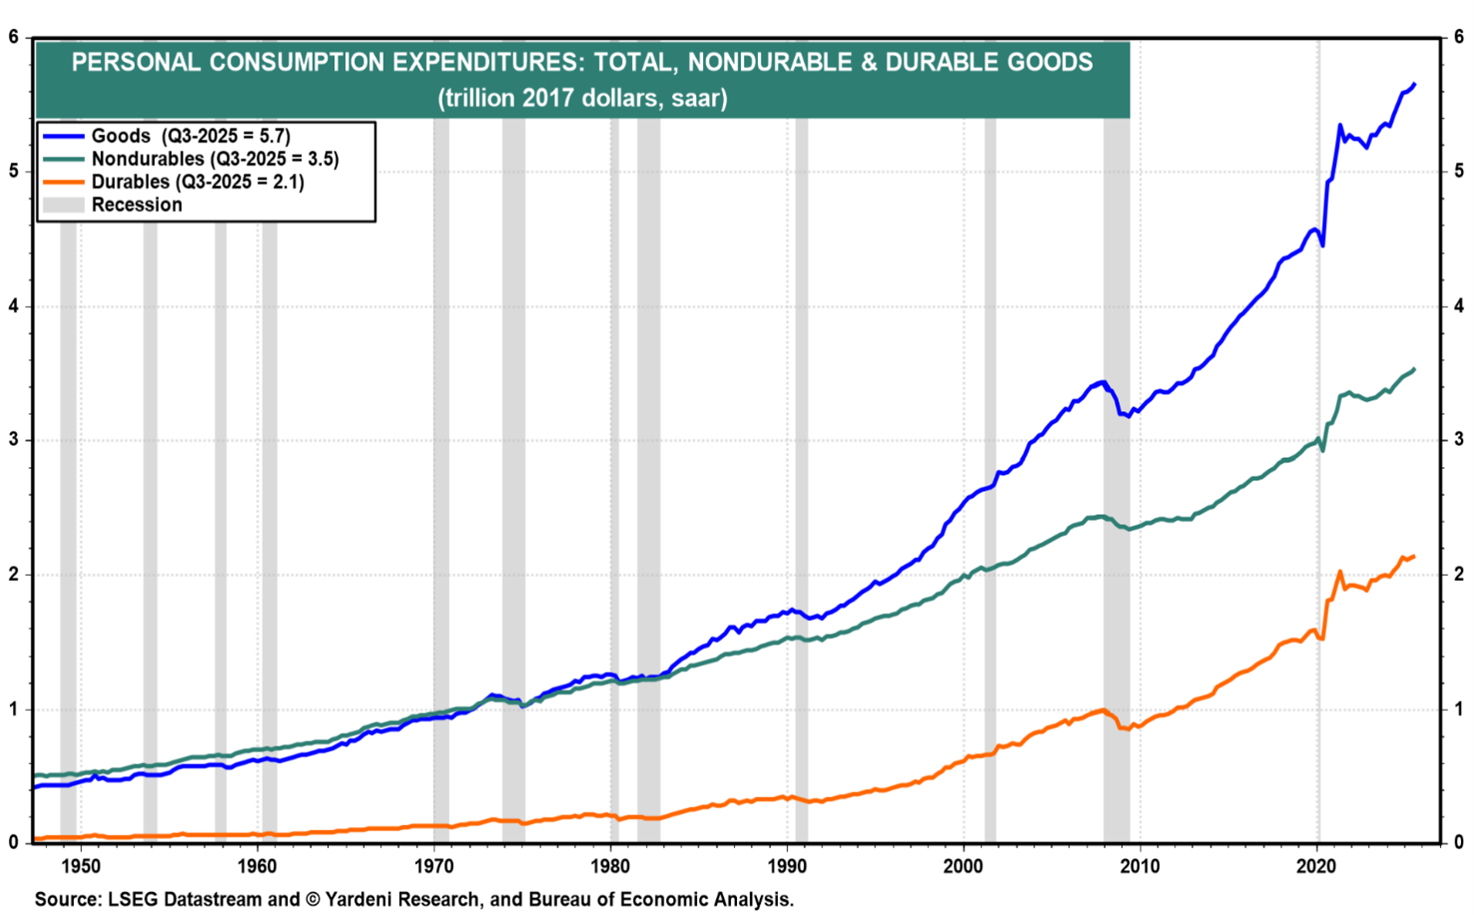
As the chart above illustrates, consumer spending remains strong. Retail spending on both durable goods (longer-lasting items such as cars and furniture) and non-durable goods (everyday items like food, gasoline, and medications) continues at a healthy pace.
Business spending tells a similar story. The chart below shows how much private businesses are spending on the assets they use to produce goods and services. This represents the capital businesses reinvest in their operations to maintain or expand production. As the data shows, this investment has continued to grow steadily.
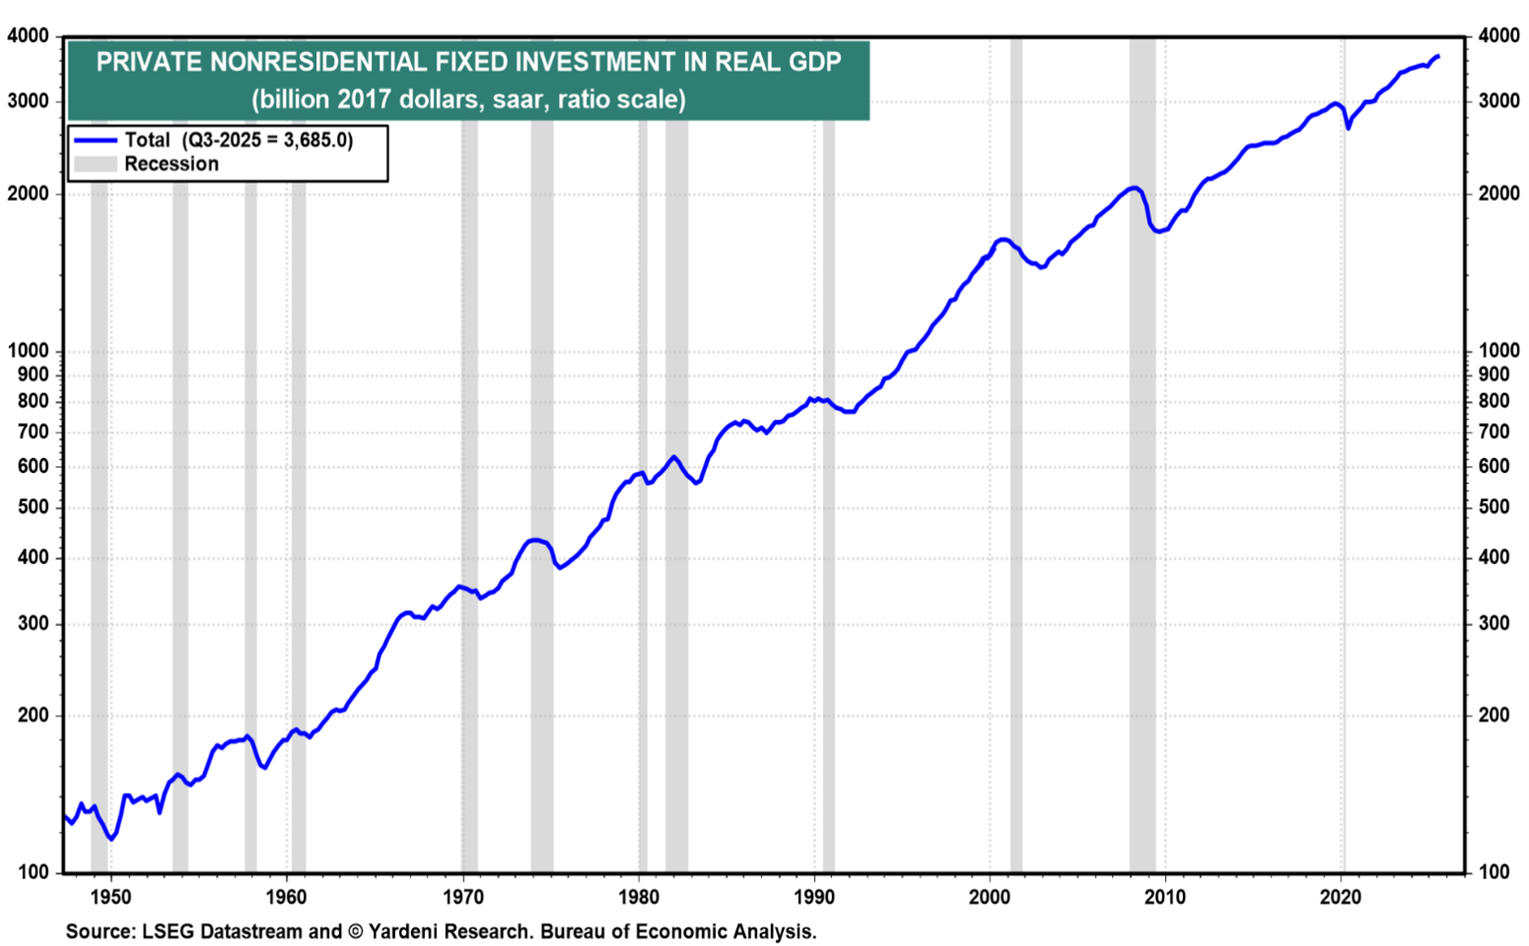
Looking ahead, we expect consumer and business spending to remain supportive of economic growth. Fiscal stimulus from tax cuts, combined with recent interest rate reductions, should provide additional tailwinds.
One noteworthy trend within business investment is spending related to artificial intelligence. Over the past several years, companies such as Microsoft, Amazon, and Alphabet have invested hundreds of billions of dollars in data centers and related infrastructure to support AI development. While we believe this trend will continue, it is reasonable to expect the pace of spending to moderate over time. The balance sheets of these companies are enormous, but not infinite.
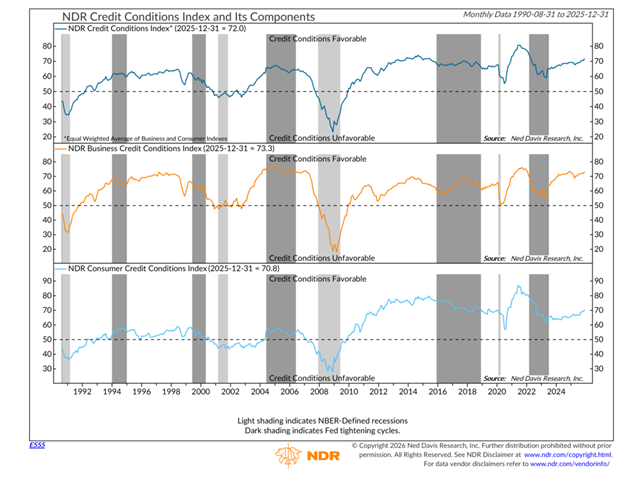
For now, credit conditions across the economy remain favorable. This is reflected in the Ned Davis Research Credit Conditions Index (CCI), shown in the chart below. The CCI measures both the cost and availability of credit in the U.S. Current readings are positive for both businesses and consumers, which is an important support for economic activity and financial markets.
One area that warrants closer attention is the labor market. Although the unemployment rate remains relatively low at 4.4%, there are signs of potential underlying weakness. Our final chart, on the next page, shows the monthly revisions to the employment report. Because timely information is critical, the Bureau of Labor Statistics releases an initial employment estimate each month, which is later revised as more complete data becomes available. Over the past eleven months, each revision has been lower than the original estimate.
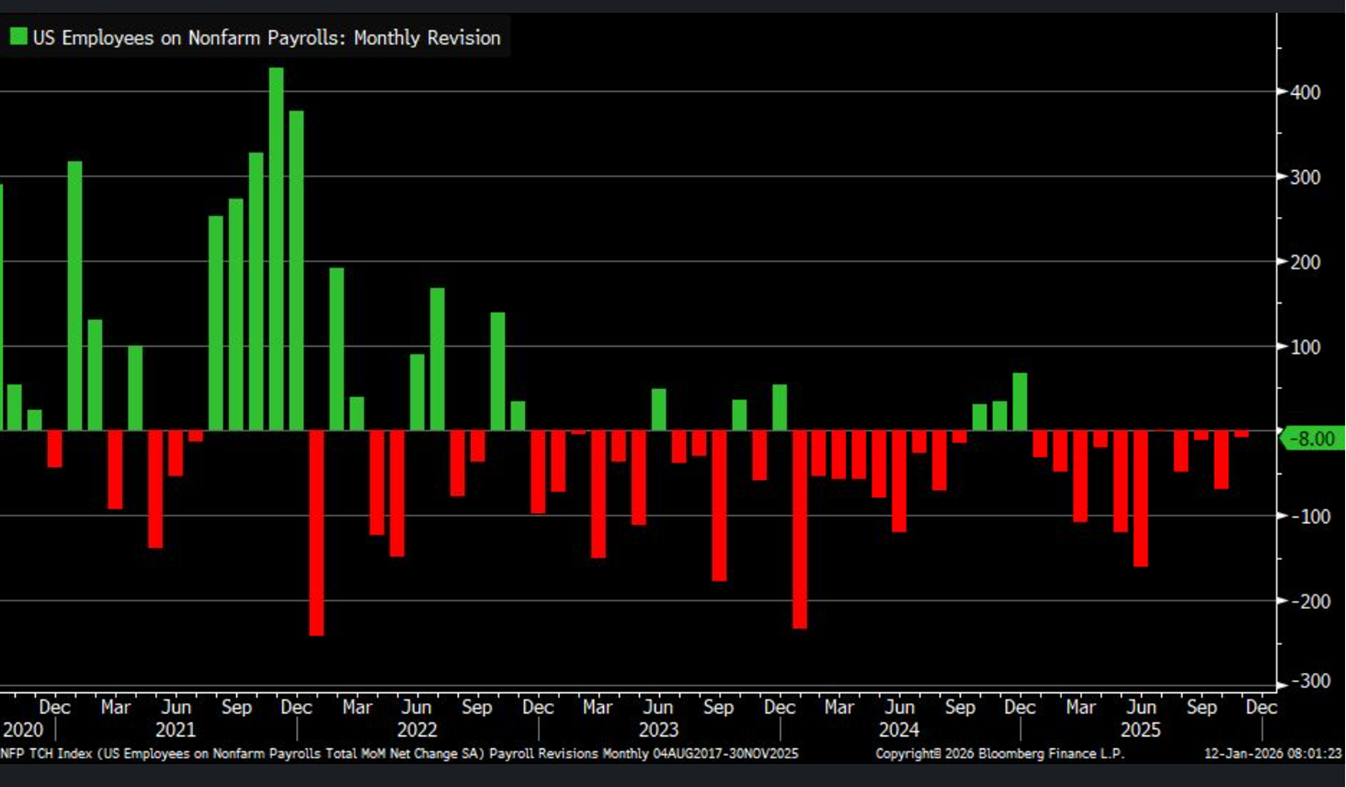
This pattern suggests the labor market might be weakening more than the headline data would suggest, and calls into question the level of consumer spending we are likely to see going forward – people who are nervous about their jobs tend to be more frugal in their spending. Again, we don’t want to let the headlines drive our decision-making. We will be watching these numbers closely, as will the financial markets, and the data will dictate our path forward.
— Brad Dinsmore
October 2025 | Politics Makes Great Theater
Geopolitics in general, and trade policy in particular, have triggered stock market volatility for as long as markets have existed. So it’s not surprising that since the election last November, we have seen politically-driven market volatility on several occasions. The most dramatic came in April, when President Trump’s “Liberation Day” tariff announcement fueled a 10% drop in the S&P 500(1*) over a two-day period. More recently, on October 10th, the S&P 500 and Nasdaq(2*) had their worst day since April – down 2.7% and 3.6%, respectively – after the President again threatened tariffs on China. His comments followed China’s announcement of tighter controls on rare-earth exports vital to many defense and high-tech industries. In both cases, markets rebounded quickly once the rhetoric eased.
The current U.S. government shutdown has dominated recent headlines, prompting many clients to ask how such events might affect the markets. While we can never know for certain, history offers helpful perspective. The chart below shows market reactions during prior occurrences.(3*)

As the chart details, during the last 21 shutdowns the market has moved just 0.3% on average, and has never declined more than 4.4%. While this time could certainly be different, history suggests that political theater rarely drives long-term economic or market performance.
So what does drive stock prices? In our view, over the long-term stock prices are driven by earnings growth, as the chart below suggests.(4*) According to the data, over the past 20 years the correlation between price and earnings for the index has been 0.94, quite close to a perfect correlation of 1.00.

Given our expectation, therefore, that stock prices will follow earnings growth, the obvious question becomes, “where are earnings headed?” Earnings growth in the U.S. tends to be driven by consumer spending, as this accounts for nearly 70% of GDP, as shown in our final chart.(5)

Consumer spending, in turn, depends largely on employment. When people feel secure in their jobs, they are more confident and apt to spend. The current unemployment rate is 4.3%, which is near historic lows. Given this constructive backdrop, we remain positive on the earnings outlook - and, by extension, the long-term trend in stock prices.
We certainly don’t mean to suggest politics are unimportant. There are obviously far more meaningful challenges both at home and abroad than the direction of the markets. But as investment advisers, our focus here is to highlight the fundamental indicators we monitor in an effort to identify appropriate investments. One lesson we have learned is that while headlines often drive short-term market gyrations, economic fundamentals drive long-term investment returns.
— Brad Dinsmore
1. The S&P 500 Index is a market-capitalization weighted index that includes the 500 most widely held companies chosen with respect to market size, liquidity, and industry. Investors cannot invest directly in an index.
2. The Nasdaq Composite is a market-capitalization weighted index that includes almost all stocks listed in the Nasdaq stock exchange and is heavily weighted towards companies in the information technology sector. Investors cannot invest directly in an index.
3. Chart Source: https://ycharts.com
4. Chart Source: https://www.factset.com
5. Chart Source: https://fred.stlouisfed.org
