July 2024 | The Benefits of Diversification
“It's tough to make predictions, especially about the future.”
— Yogi Berra, Former New York Yankee Catcher
Yogi Berra won 10 World Series and was an All-Star 18 times, but even with his remarkable consistency he saw the future as shrouded in mystery. For investors, discerning a path forward for the economy and markets might be as difficult as catching a no-hitter in baseball (though Yogi caught three, including the only Perfect Game in World Series history). Economists search for patterns and indicators that tend to move ahead of the economy, believing that the past might shed light on the future. But the world often spins unpredictably like the best curveball, and an indicator that has worked very well over multiple cycles will suddenly prove ineffective. For example, a so-called ‘Inverted Yield Curve’ - wherein long-term interest rates fall below short-term interest rates - has long been an excellent indicator of coming recession. And yet, 2-year and 10-year Treasury Bond yields have been inverted since July of 2022, the longest inversion on record (1*), but no recession has occurred. Similarly, the Conference Board’s Leading Economic Indicators (LEIs) had an outstanding track record over several cycles but signaled a coming recession more than two years ago, before recently reversing course and suggesting no recession on the horizon. The failure of these historically dependable gauges suggests to us that looking at a broad and diversified group of indicators, while certainly not fool-proof, is more likely to provide useful insights as to our economic future. Yogi didn’t win 10 World Series by himself, it takes a team to be successful.
The chart (2*) provides an excellent example of the value of a broader look at the economy. The top section illustrates economic growth in the US over the past 75 years. The bottom section shows the Economic Timing Model from Ned Davis Research. The model takes into account 27 different indicators, each monitoring a different sector of the economy. This broad model has been quite effective, providing a correct signal of either expansion or contraction 88% of the time over several decades. Its current reading suggests the economy will continue to grow at a moderate pace.
Since WWII, the US has experienced a recession approximately every 6 years. Other than the very brief, Covid-driven contraction of 2020, we haven’t seen a serious recession since 2008-09, some 15 years ago. Given this run of consistency, it’s not surprising that investors have become a bit complacent. The chart below (3*) shows the S&P 500 (4*) above and the VIX Index below. The VIX Index is a measure of the stock market's expectation of coming volatility. The current reading suggests investors see very little risk in the markets. As detailed in the box at lower-right, when the VIX is at these levels, market returns tend to be quite weak. This suggests to us that much of the positive economic news may already be reflected in current stock prices.
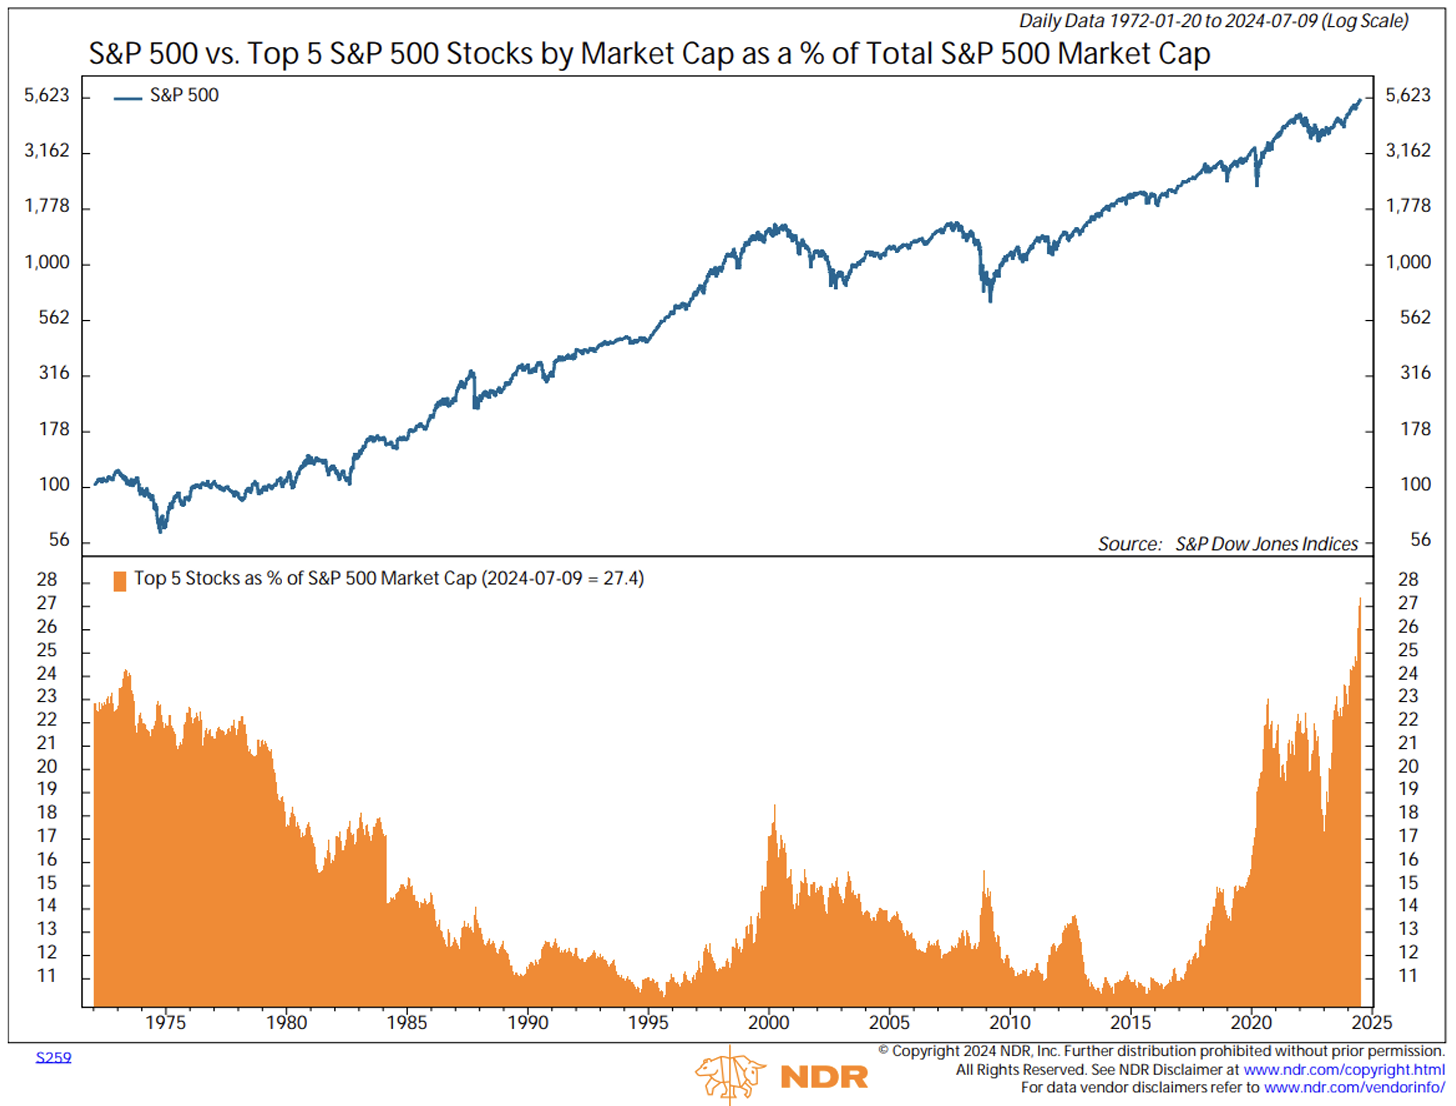
In a sense, using a broad array of economic indicators as we discussed above is a form of economic diversification, and something that we believe can drive better forecasts. When it comes to client investments, we believe diversification to be similarly beneficial. In our view, while it certainly doesn’t guarantee against loss, diversification is a very important component of reaching longrange financial goals while minimizing risk. Over the last 18 months, a handful of stocks have dominated the markets, growing to unprecedented size and providing very strong returns. Our final chart (5*) shows that the five largest companies in the S&P 500, or 1% of the stocks, now make up more than 27% of the index’s value, the largest concentration in more than 50 years. This extreme outperformance by a very small group of stocks has led diversified portfolios to trail the index, but history would suggest this is unlikely to persist. The last time we saw concentration close to this degree was in the early 1970’s, when the so-called ‘Nifty Fifty’ stocks dominated the market. After this period of outperformance, the Nifty Fifty declined significantly.
As most of you know, Cornerstone Capital was founded in San Francisco and the partners remain loyal Giants fans and season ticket holders, so no baseball-themed letter could be complete without a mention of, in our view, the greatest baseball player who ever lived, Willie Mays. Willie passed away on June 18th of this year, ironically here in Palo Alto. His abilities on the field were legendary, leading to a hard-to-fathom 24 consecutive All-Star appearances. The key to his game was versatility – Willie had multiple seasons where he led the league in home runs, stolen bases or slugging percentage, while also winning 12 Gold Glove Awards, given to the best defensive player at each position. Willie Mays was known as the ultimate 5-tool player – meaning he was the rare position player who excelled at all five major physical tools of the game: hitting for average, hitting for power, speed, throwing, and fielding. You might even say Willie’s remarkable skills were a testament to the value of diversification.
— Brad Dinsmore
1. Source – Reuters Article
2. 3. 5. Charts sourced from Ned Davis Research, Inc.
4. The S&P 500 Index is a market-capitalization weighted index that includes the 500 most widely held companies chosen with respect to market size, liquidity, and industry. You cannot invest directly in an index.


