April 2025 | Sniffing Out a Path Forward
Walking Yogi, my 3-year-old Bernese Mountain Dog, is a study in patience. If you are looking to go for a run or even a brisk walk, Yogi is not your guy.
Bernese are well known to be smart and exceedingly kind but also a bit stubborn, and they are blessed with a sense of smell purported to be up to 100,000 times that of their owners. This leads us face-first into virtually every plant, flower, tree, dog or human in our path. I have no idea what he’s learning, but his curiosity is boundless. Watching his endless investigation on our walk this weekend left me wondering if maybe he is the one creature capable of sniffing out where the current tariff turmoil might lead.
President Trump’s “Liberation Day” tariffs have walloped the stock market, and unless negotiations with our trading partners yield prompt results, they will significantly impact the real economy in short order.
We see two potential paths forward:
Scenario 1. The Trump Administration, in an effort to bring as much manufacturing as possible back to the U.S., sticks to these massive tariffs and fully abandons the idea of comparative advantage. This outcome would likely lead to stagflation (slower growth and higher prices). In previous periods of stagflation, stocks in defensive sectors like consumer staples, healthcare, and utilities performed relatively well, but the overall market suffered.
Scenario 2. The recently imposed tariffs are an opening salvo in the administration’s plan to negotiate more favorable trade agreements. Under this scenario, as negotiations progress, tariffs will be significantly reduced and the world will settle into a new, but relatively familiar era of global trade. We would expect this to lead to a revival in stock prices across the market.
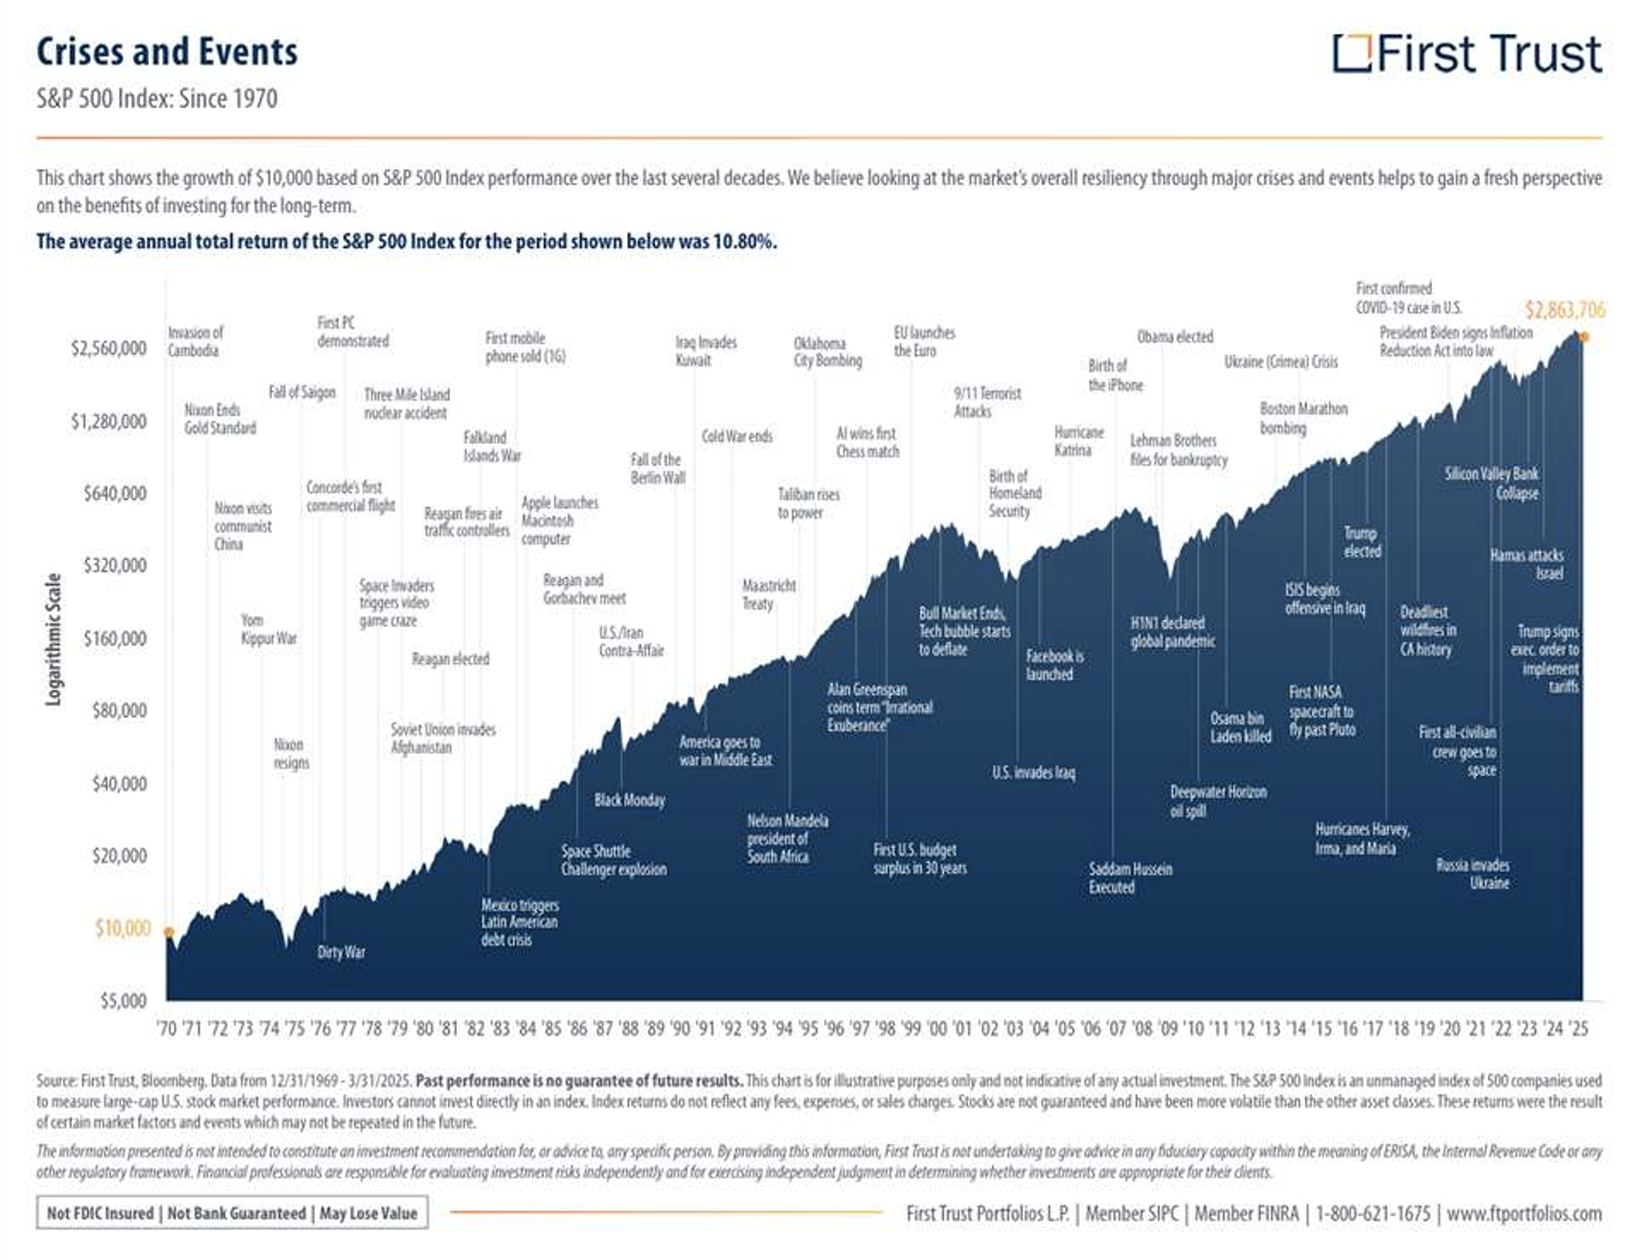
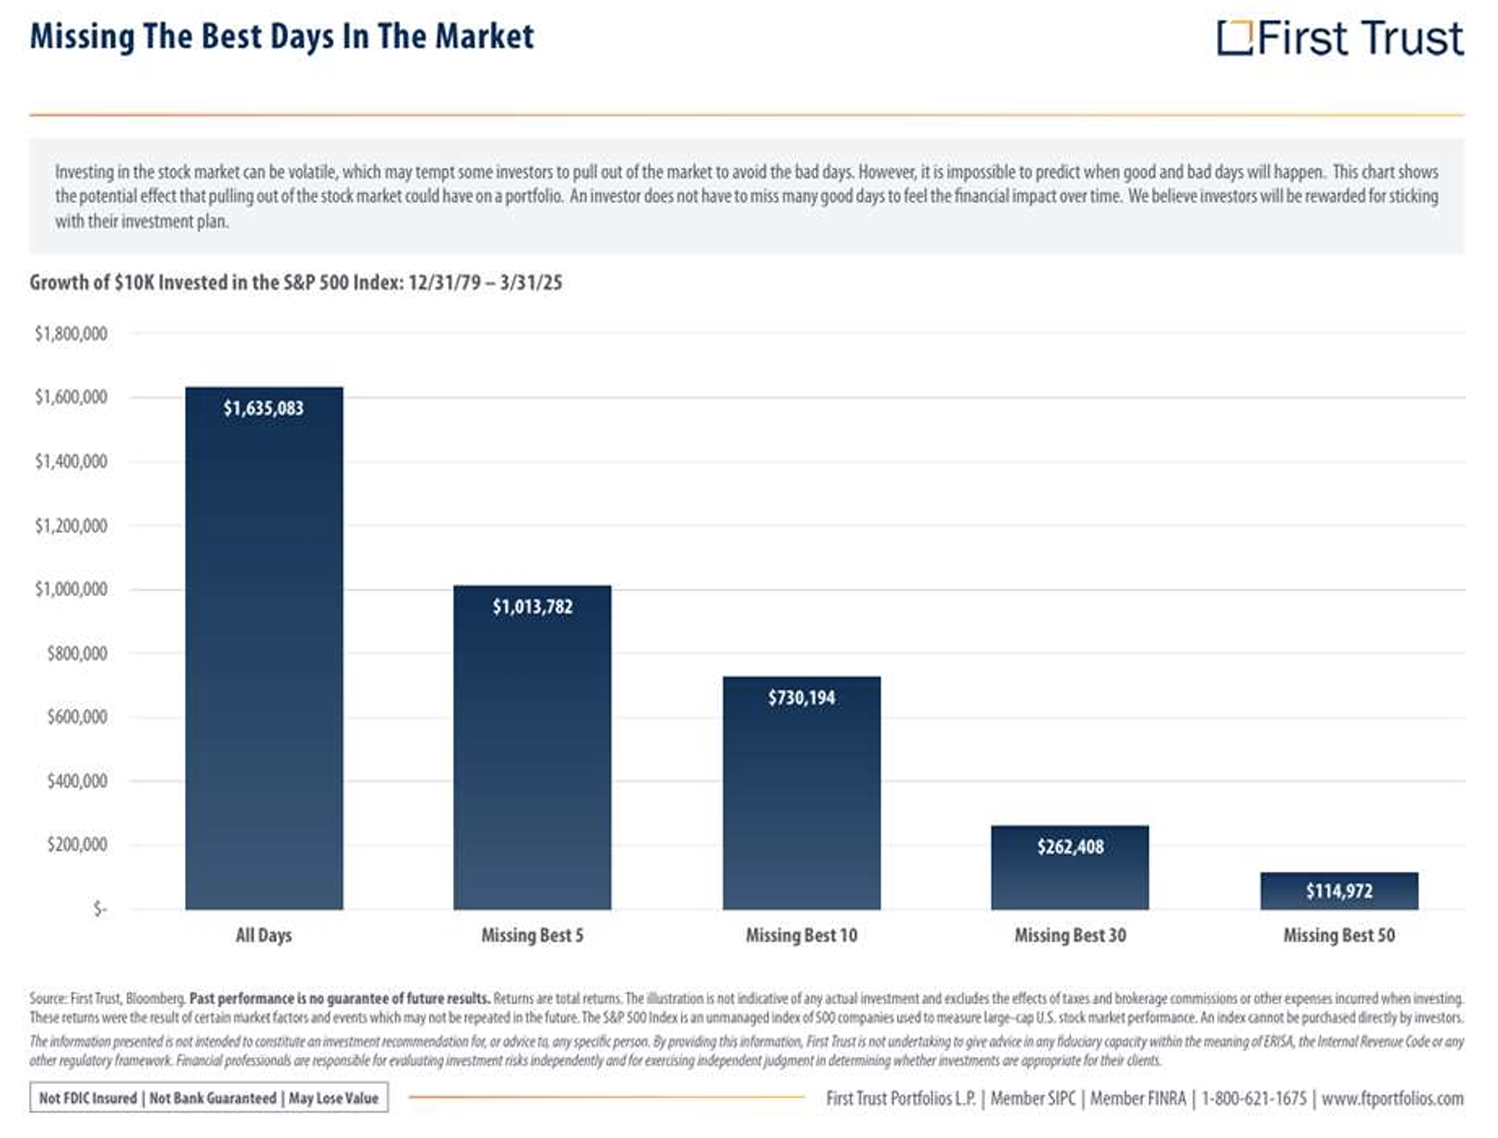
In our view, scenario two is the more likely outcome – Mr. Trump has spent a lifetime working on “The Art of The Deal” and we expect he has brought that mindset to the Presidency. That said, trying to predict short-term outcomes to jump in or out of the market has generally proven to be a mistake. The following charts are instructive when dealing with this kind of volatility. The first shows market returns since 1970, alongside the crises and events that have shaped both markets and investor sentiment over that period.
As you can see, despite numerous challenges over the past 55 years, the economy has continued to grow, and the stock market has reflected this long-term progress. The second chart (below) shows the significant detrimental impact of being out of the market if/when a rally occurs. Missing just a handful of key days can dramatically reduce long-term returns.
While the stock market has experienced significant volatility with each tariff announcement, the bond market has remained relatively stable. From April 2 (“Liberation Day") through April 7, 3-5 Year Treasuries have risen by 0.39%, while the S&P 500 Stock Index(1*) has declined by nearly 10%. Bond traders may be reflexively pricing in the simplest scenario – a short-term economic shock followed by a rapid return to the status quo. Even if this rosy scenario fails to play out, the relative predictability of bond payments often leads to greater stability for high-quality bond investments in times of crisis.
If unusually high volatility continues, which we view as probable in the near-term, equityonly portfolios should benefit from an allocation to more stable and predictable sectors. Balanced portfolios will likely see further benefit from an allocation to high-quality bonds. We fully understand that living through these periods can be stressful, and we want to remind our clients that we are here and happy to talk through your financial circumstances at your convenience. And if a chat with Brad, Mason or me doesn’t fully put you at ease, Yogi is available for long (very slow) walks any time.
— Brad Dinsmore
1. The S&P 500 Index is a market-capitalization weighted index that includes the 500 most widely held companies chosen with respect to market size, liquidity, and industry. Investors cannot invest directly in an index. Indices and other financial benchmarks shown are provided for illustrative purposes only, are unmanaged, reflect reinvestment of income and dividends and do not reflect the impact of advisory fees. Comparisons to indexes have limitations because indexes have volatility and other material characteristics that may differ from client portfolios.


